Lab Experiment 2: Counting Statistics and Error Prediction
Purpose:
- To understand the statistical nature of radiation.
- To calculate statistical quantities.
- To perform uncertainty analysis on a set of acquired data.
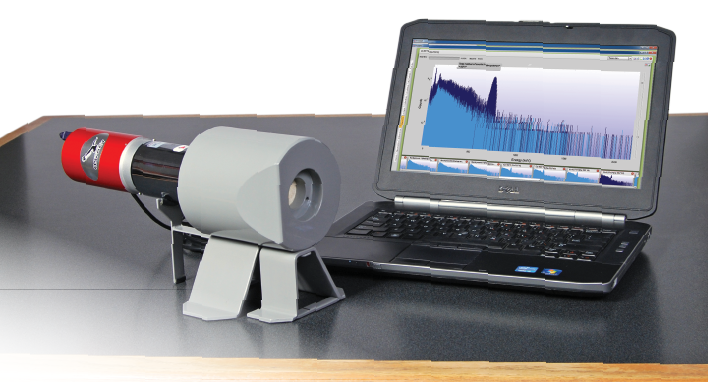
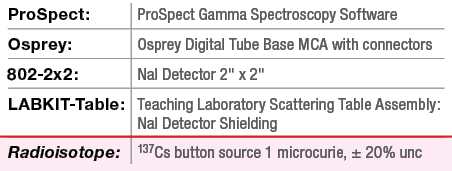
Equipment Required:
Theoretical Overview:
Radioactive decay is a random process. In an experiment, the number of counts obtained will fluctuate due to the statistical nature of the data. One can predict the distribution function that describes the results of many such repeated measurements.
Three common statistical models that are used in radiation counting are:
- Binomial distribution
- Poisson distribution
- Gaussian distribution
Statistical analysis
The basis of any statistical distribution is the variation of a given measurement from the true value. The true value is often determined experimentally from a set of measurements, and includes both the experimental mean as well as the standard deviation. The experimental mean for a set of N independent measurements can be expressed as:
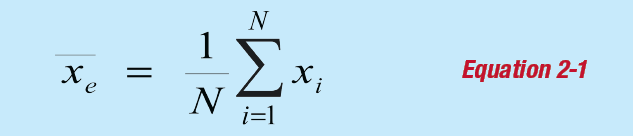
where:
N is the total number of measurements and Xi is the value of a given measurement.
Meanwhile, the sample variance is expressed as:
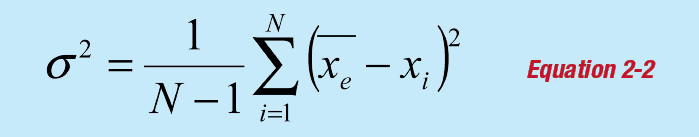
The square root of the sample variance is the standard deviation of the sample, which is often used to quantify the level of uncertainty of a value being measured.
Uncertainty propagation
Let us assume that three independent variables x, y, z are directly measured with uncertainties σx ,σy ,σz.
The difference in the measured number of counts, u, between x and y can be expressed as:
![]()
The propagated measurement uncertainty becomes:
![]()
The same applies to the sum of the counts. The sum of the counts x and z can be expressed as:
![]()
The propagated measurement uncertainty for the sum of x and z is:
![]()
Poisson distribution
The Poisson distribution is “characterized by a constant and small probability of success for each individual trial” (refer to Reference 3 on Page 77). Consider the probability of a nuclear decay occurring in a certain time interval.
Does the probability go up or down if the half-life of the material is small?
The expected standard deviation for one measurement subject to Poisson fluctuations is:

(Since the mean value is approximately the same as any typical value). If the data fits the Poisson model, then your experimentally-measured variance should be approximately the same as the calculated variance.
Chi-square analysis
An experimenter should always ask the question: is obtained data true, or is it affected by some extraneous disturbances? One of the more frequently used tests to check the goodness of the data is the χ 2 (chi-squared) test:
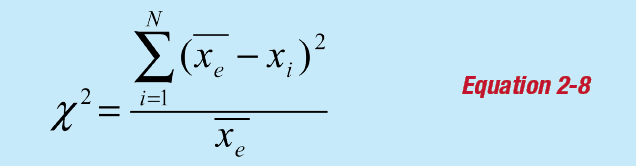
where:
Xi and Xe represent the N individual measurements and average of the N measurements.
To evaluate the chi-squared test, the expected result for data fitting a Poisson distribution is equivalent to N – 1. The greater the deviation from N – 1, the greater the variation of the data from the expected behavior. If the deviation is large, this may lead the experimenter to investigate further into the experiment, whether this is reviewing the expected result or reviewing the experimental data.
Experiment 2 Guide:
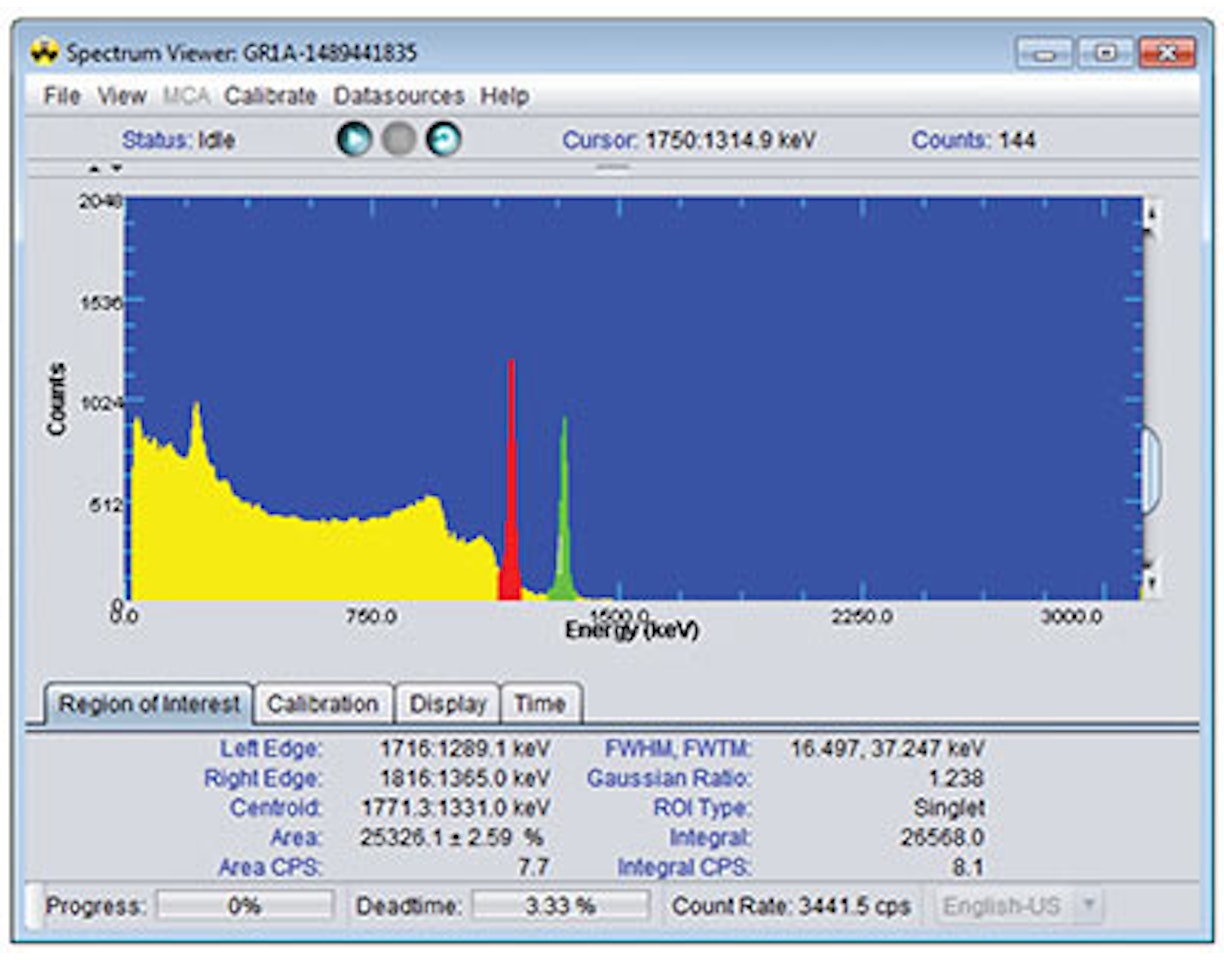
1. Connect the Osprey and NaI detector and configure as recommended in Experiment 1. Adjust the gain such that the a 137Cs photopeak is in the center of the spectrum.
2. Record a set of 20 background readings from a NaI detector. Set the PHA acquisition preset live time in ProSpect to be 30 seconds for each measurement.
3. Once this data has been taken, place a 137Cs source near the detector. Repeat the measurements with the source present.
Warning: do not change the geometry of the detector and source once you start.
4. For each set of data in steps 2 and 3, calculate the experimental mean (Xe) and the sample variance (σ2) using Equations 2-1 and 2-2, using the total counts in the spectrum.
5. Calculate the uncertainty of a single measurement in each case which in this case is given by: σi = Xi
6. From the results in Steps 4 and 5, comment on whether the data fits with the Poisson model of data.
7. Apply the χ 2 test to the sets of data obtained in steps 2 and 3. Comment on the results.
8. Calculate the standard deviation on the net counts (the average source count minus the average background count) using Equation 2-4.