In-situ spectroscopy can be challenging. We brought together a panel of Mirion experts to answer some tough questions and make informed recommendations. See what our panel had to say about in-situ applications and technology.
This Q&A session was hosted by Kara Phillips, Product Line Manager for Gamma Spectroscopy Software and Services at Mirion.
Q: Would you mind talking to us about what recommendations are made for modeling?
Nasser Rashidifard is an Application Support Manager for the Detection Measurement Division at Mirion.
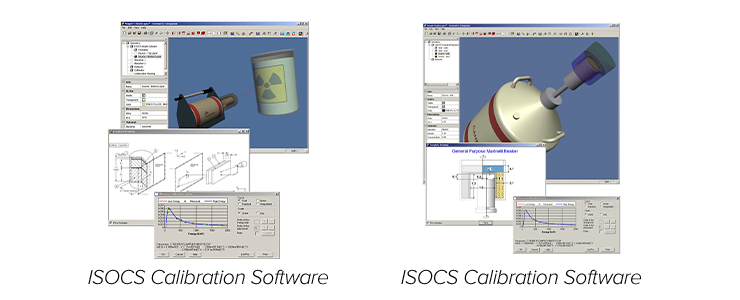
Nasser: For modeling a mathematical calibration, you always want to make sure you have the closest match. My experience has always been on complex pieces of equipment. I use a lot of process knowledge to determine where the source term would be, whether it is at an impingement point or if there is a porous surface. We have a handful of geometries in ISOCS™ and LabSOCS™ software, which will cover different uniformities, including attenuation coefficients, relaxation lengths, activation and concrete, and the subsequent attenuation from that. If I cannot find a model in the ISOCS and LabSOCS software, I will always choose the model that most closely represents the likely contamination location based on process knowledge.
Sometimes you have to look at some of the absorber parameters and incorporate them. For example, I was doing a moisture separator reheater for a pressurized water reactor (PWR). The impingement point was going to be on the internal chevron plates that the steam first comes into contact with. We could not survey all of it at once, so we actually verified it was there internally based on modeling in ISOCS. If you have a lot of activity far away or a little bit up close, you are going to get the same number of counts, so you want to be as realistic as possible with some margin of conservatism. We used that methodology and all our process knowledge to determine where the source term would be. We matched a planar source at those distances, compensated for the wall thicknesses, and took those measurements. In the end, we were successful in our modeling by confirmation from follow-up surveys during the cutting process for disposal.
You have to be very meticulous on your parameters. When you order containers online, they can say they contain a certain density in plastic. At times, I have found them to be different, or they send you the equivalents because you are looking at ordering in volume. You want to make sure you are very diligent. I have gotten scales out and measured the densities of containers and accounted for those in models.
Q: What about recommendations for calibration?
Nasser: With most instrumentation, especially using high-purity germanium, there is no need to worry about whether you are 0-2 MeV or 0-3 MeV for typical in-situ measurements. You are going to run 16,000-32,000 channels, so the detector will handle that. You may need to focus on those parameters if you are using a scintillator-based detection system or a CZT system, which does not do very well at very high energies.
I always use the multi-line source. The ISOCS detectors come with the europium sodium source which covers a wide range. I use europium-152 in my personal work, or mixed gamma sources are always great. If you are looking at something like uranium concentration plutonium, something with very, very low release limits, potentials for high-uncertainty and low-energy photons—if you are going to have a variety of them—you can always pick a representative one and have a standard made. For measurements based on your decommissioning plan, that will bind your measurements, you can choose the nuclide that is the one which you ratio everything else to. Then, you can leverage the ISOCS software to have different matrices, different fill heights, different densities, and go from there.
The main takeaway is, ground it as much as you can because it is very powerful. You need to be diligent in how you use it and ground it once in a while to make sure you are on the right path.
Q: What kind of detectors would you use for a given application?
Greg Landry is an Application Support Manager and Product Line Manager with over 21 years at Mirion.
Greg: Obviously, there is a distinction to make between scintillators and HPGe detectors. HPGe detectors are always going to be the best due to the resolution that you can get. If there are environmental conditions or price restrictions that push you to the scintillators, then sometimes they are the best choice.
Focusing on the germanium detectors, Mirion has a number of models that are configured differently, and the primary configuration differences are going to be where their contacts are relative to what you are measuring and the entrance window on the detector.
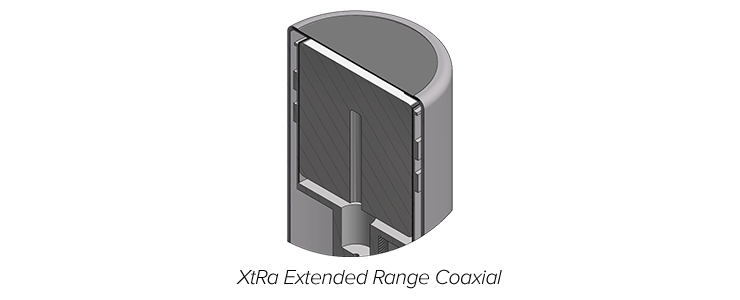
One of the main considerations you are going to need to factor in is the energy of the photons that you are trying to measure. If you are looking at particularly low-energy photons—less than 40 keV—that is going to drive you toward a broad energy germanium detector or a reverse electrode germanium detector. We also have a specialized coaxial detector called the XtRa™ detector that has a very low-energy entrance on the face of the detector.
If your energy considerations are not that restrictive, and you are focusing primarily on measurements higher than 40 keV, then you can start looking at the various coaxial detectors. We have our simple electro-germanium detectors, historically been called “coaxes.”
Another consideration you want to factor in is the shape of the crystal itself. The aspect ratio of the coax detectors tends to be more of a longer cylinder, whereas the broad energy germanium detectors are approaching more of a flat planar detector (flat relative to the coax detectors). If you are doing something where your efficiency would be improved by having that longer cylinder, you might want to factor that in, assuming you are not trying to look below 40 keV. An exception for that would be our reverse electrode germanium detector (REGe™ detectors). These are actually coax detectors, but basically the whole detector is compatible with low energy measurements all the way down to a handful of keV.
Q: When making a one-shot (open detector geometry) in-situ measurement, we have to assume homogeneity of an activity distribution, but this assumption often isn’t strictly true in practice and introduces bias to the results, especially if the true activity location is really on an extreme edge or a center position. This bias is reduced with greater detector-item distance, but closer detector-item distance is preferred for counting statistics and better MDAs. How can we calculate the best compromise in detector standoff distance to achieve good statistics while minimizing the possibility of inhomogeneity bias?
Sean Stanfield is Director of Measurement Services with over 22 years at Mirion. He has a bachelor’s and master’s degree in Nuclear Engineering.
Sean: There are a few tools you could use, starting with ISOCS software. You can do some sensitivity modeling doing some near estimates on the source location, which could be heterogeneous, and then doing some homogeneous modeling as well to try and understand where your uncertainties are based on your detector distance.
You can also consider some of those biases, not just in your measurement itself, but also in your measurement uncertainty. We have processes where you can take certain containers or certain in-situ objects and actually do an estimate on your uncertainty for various spots where that hotspot might be or where the activity might be in relation to your detector. A lot of this would require an amount of modeling and work up front. If you have the time, you can also take some empirical data to try and understand where it might work for that specific measurement. But really it would take some modeling work up front, probably with ISOCS software, IUE or other types of modeling tools. We actually do see that a lot in some waste site measurements. We model different locations in, for example, a drum, and pull that total uncertainty into our measurement result.
Q: What are some of the advantages and disadvantages of setting up a significance threshold?
Greg: The significance threshold fundamentally is a sensitivity setting used by the second difference peak search engine. Its fundamental purpose is to screen out garbage that is not peaks so that you can focus on peaks that are actually in the spectrum. We typically recommend 3 as a starting value because that approximates a critical-level test. Fortunately, we have an actual critical-level test in the peak analysis step. But as far as manipulation of that parameter, I have seen two things done other than leaving it at 3. For detailed analysis, I have seen it drop to around 2.5 to get a look at what might be below critical level before that stuff gets screened out by critical level. Additionally, during calibrations, I personally will increase it high enough where I do not see any garbage in my calibration spectra other than the calibration peaks I am focusing on, at least for the final reports.
Q: What are some error traps and common issues that might come up?
Nasser: A lot of times I get called in to do boxes or drums where we do not have prior knowledge and we need to assess the magnitude of risk before going in. If you can get as much process knowledge as you can up front, that saves you a lot of potential for errors later on—for example, knowing the non-radiological risks such as chemical, biological, or medical waste can limit the handling of it or pose an unforeseen safety risk. Also, not knowing your source term, you will have to do an analysis or make some assumptions on composition, distributed or discrete, etcetera. If you make too-conservative assumptions, it can really drive up your MDA and drive up your count time. Usually, you are counting to some sort of action level or derived concentration guideline level (DCGL) or release limit. If you count for long enough, you can see almost everything in the chart of nuclides, so you want to count to where you get what is in your survey plan.
Another issue I have seen is not giving enough physical space to walk around samples. If you have the advantage of being able to lay down the material or have it configured so you can safely and easily move around it, you can save yourself from having to do custom ISOCS models on the fly. And, you can use the same consistent geometry each time. In a case where you cannot get your cart over a threshold or curve on the ground, essentially you would have to wing it and it will stand out as something different from the rest. That could lead to some other errors, especially when being audited by a regulator and justifying why.
Some common issues I have had are electrical power generators imparting a lot of electrical noise in systems. I have had to use three power conditioners in a chain because the power was so dirty coming from a generator. So, if you have an opportunity to work on direct current (DC) power and go DC to DC, that is preferable.
Temperature shifts. You will get an energy gain shift, particularly in the liquid nitrogen ISOCS equipment where you get a lot of condensation. And when you have 4,000 volts and condensation, sometimes it is problematic. Those are a couple of safety things to watch out for.
Some instrument-specific concerns are related high-purity germanium detectors. They are the best in terms of in-situ resolution and performance, but they are also complex and large. They require a little more care and feeding than some of their scintillator cousins. On the other hand, the scintillators are very practical if you have a simple spectrum or common nuclides. But, people also forget that they are delicate and could break if you are not careful. Those are some of the concerns I had with selecting instruments for the job. You may need to tailor your instrumentation based on the physical layout of your material. If you do not have a lot of space, scintillator solutions may be what you are left with because you cannot get a germanium in those tight spaces. But, if you have the opportunity, germanium is always my choice.
Q: When we have the ISOCS cart pointed in the downward position, how do we account for the base of the ISOCS cart shielding when doing the survey?
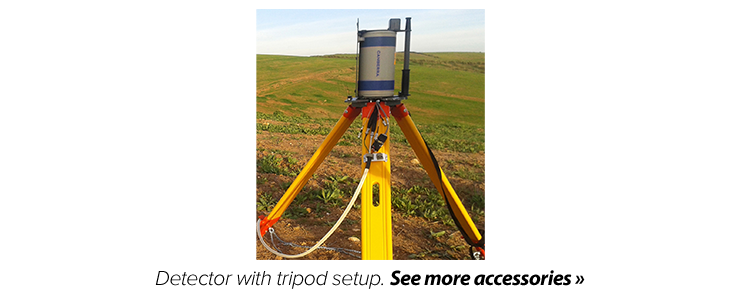
Greg: The characterization and the model does not take account for it. I would try to avoid pointing the detector of my ISOCS cart downward if I could. But, if you need to factor in some additional shielding, you can play with one of the absorbers. You are going to have to do some hard approximation to simulate an ISOCS cart component with an infinite-plane absorber, but I think that is the best chance you have. We do sell a tripod that is used for ISOCS work, particularly soil measurements out in the field. Just pointing the detector down using the tripod would completely alleviate something in the way of the detector, other than a couple of little metal legs, which I think is fair to exclude and ignore. Find more details in our ISOCS in-situ accessories page.
Nasser: Shooting downward can always be tricky. Depending on the vintage of carts or if you have a Genie™ lift, you might have a plate that could be plate steel or plate aluminum. You are pretty much shooting chest height or waist height in that configuration—a tripod solution is much better. If you can handle a 4π presence to the detector from the field, you can shoot downward uncollimated. If you are over where you need to be, your efficiency is going to be driven by that small area of interest in front of you, because everything just drops off with the inverse square law. So, that is probably the best method as long as your backgrounds, MDAs and count times can meet your survey criteria. With a tripod, you can do some light shielding around it. An advantage of the tripod is that you are a little higher up than the cart, so you get a slightly larger field of view. If you are doing aerial surveys for activity, that would probably be the ideal choice. It is pretty common for D&D sites to use a tripod setup.
Q: What is the best method for applying lump corrections for small lumps of U or Pu using the ISOCS solution?
Sean: We actually have a SAC correction algorithm that is part of NDA 2000™ software that you can integrate with Genie software. Once you have done your analysis in ISOCS software, you can use that self-absorption correction algorithm to do some lumping and correction as well. That is not directly ISOCS modeling, but if you have a pretty good idea what your model is, then your SAC can help correct that. It is not necessarily something everybody can do. A Mirion expert may need to help to pull that out of NDA 2000, but we have done that before.
Besides trying to model it directly in ISOCS software, we have recently started using differential peak analysis a little more. This portion is integrating some data on the back end that we call “figure of merits” to help define your efficiency curve. If you have lumping, you can adjust your model on the fly or during your analysis based on what you are seeing in your figure of merits. A lot of that information is based on how much you can actually see in your measurement. But, if you are doing lumping, I assume you are seeing a decent amount of response.
Those are the two most common methods for us. Both of those methods have been tested and certified at WIPP and have gone through a blind analysis through the performance demonstration program at WIPP.
You could also go more in depth and use ISOCS software on your own to try to determine the best sort of lump correction in your model. You could use some of our various model templates to try and locate your lump with imaging technology or do some sort of transmission. Usually for in-situ measurement, it is difficult to do any sort of transmission. But, if you want to go more in depth, you could locate it knowing where the lumping is and trying to model that directly in one of the ISOCS templates.
Q: Where could we get more information on this, or hands-on training?
Sean: You could do a hands-on program directly with some Mirion experts. There is also some training you can get through our Services group. But if you would like to know specifics on how we do that inside the WIPP program, you could contact me and we can discuss it directly. Or you can find information on our website.
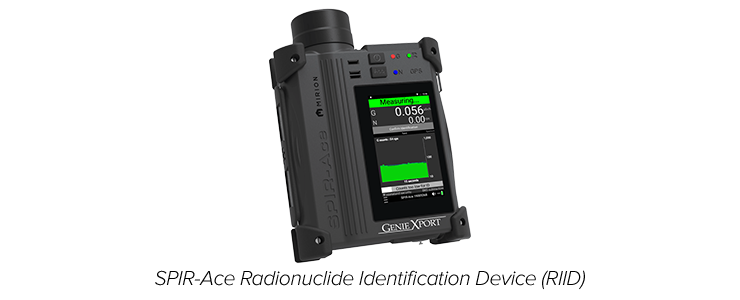
Q: How do you use the SPIR-Ace™ LaBr detector to do in-situ determinations of aerial activity (uCi/m^2). We’d like to use the instrument after a nuclear plant release to determine plume homogeneity. We would compare two isotopes’ relative concentrations (i.e. I-131/Cs-137).
Nasser: For this application, the best option is the GenieXPort™ function. By itself, the SPIR-Ace unit is a straightforward RIID. It has a predetermined, internationally agreed upon algorithm that is based on some of the ISO standards. It does not easily lend itself to activity. But, with our version, we are able to port that spectrum file from the RIID algorithm into a standard Genie format.
So, the best way to use it is to determine one for an area if you are going to hold it at head height, ground height, waist height—whatever your scenario—and generate a representative ISOCS model (or maybe a LabSOCS model depending on your configurations). You can generate that efficiency using the generic characterization with the SPIR-Ace unit. Then you can load that efficiency file into the SPIR-Ace unit and when you get to an area, you can collect a spectrum.
Using a reachback feature via Wi-Fi, SIM card, cellular network, or even a USB cable to the SPIR-Ace device, you can collect that spectrum on a PC laptop or a Windows tablet, and then process using Genie software. All the efficiency calibrations will carry over to the PC, so you can process it using all the standard Genie templates and reports that any of the regulators or RadResponder agencies are familiar with. This also enables you to make note of what time you collected it and how long you collected it for, because you can input that in the Genie software and it will back-correct activity. The great feature with reachback is that you can have someone processing in a command center while someone is out in the field using their device, and they will not have to do any calculations. It just feeds back directly.
Regarding some ratios of nuclides, there are two methods. One is very similar to the previously discussed method. You want to process using Genie software. It will handle all the yields, especially decay correction. Iodine can be short lived with respect to Cesium. Genie software will handle all that and then give you the ratios of those nuclides.
A quick, informal way to do it is by using the display of the SPIR-Ace unit itself. It will show you the spectrum locally on the device. You can pick out the centroids, ratio the count rate and the centroids, and then you would have to perform some calculations for yield. You also have the spectrum, so you can validate it when they post-process or shortly after.
Q: Is it possible to do source localization, isotopic identification, and mass determination in a space and time with the source on the move and building up in various locations in an industrial process environment?
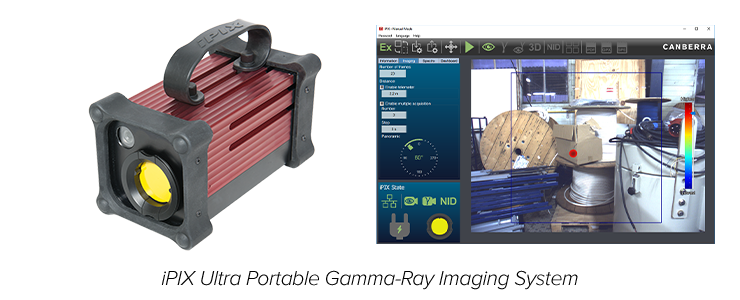
Sean: For source location, obviously you can use handhelds to try and find a hotspot. One of the tools we do have is the iPIX™ portable imaging system. This gamma camera can locate specific types of hotspots for various measurements. The iPIX camera does not always identify. In these cases, once you have a spot located, you could integrate a SPIR-Ace measurement.
You could do some other type of gamma spectroscopy measurement once you know where the source location is, and do some isotopic identification using either the SPIR-Ace unit or maybe a germanium like the Aegis™ portable detector, which you could take into the field. But the best option would either be source location through a handheld measurement or the iPIX system to really find something in a building or in some sort of process, not knowing anything else about the measurement.
Nasser: Source localization is not easy and a lot of the tools trade off qualitative and quantitative results because each one has a slightly different tool set. Like Sean said, the iPIX camera is pretty good depending on the source. If it is small, any sort of visualization is difficult. If it is a high-activity source, it can be pretty quick.
Another technique is, ALARA permitting, you can take multiple directional shots, manipulating it, for example, at 90 degrees, 180 degrees or on end. When you adjust your ISOCS model for each one, you will find them converging as you get to the correct location. It does take a bit more work. If you are using a plant process where the source term is actually moving in time, gamma imaging is tough. It usually needs a fairly high-activity source. We have a product, the HDR-Vue™ system. It is a medical product, but it does source visualization with live video.
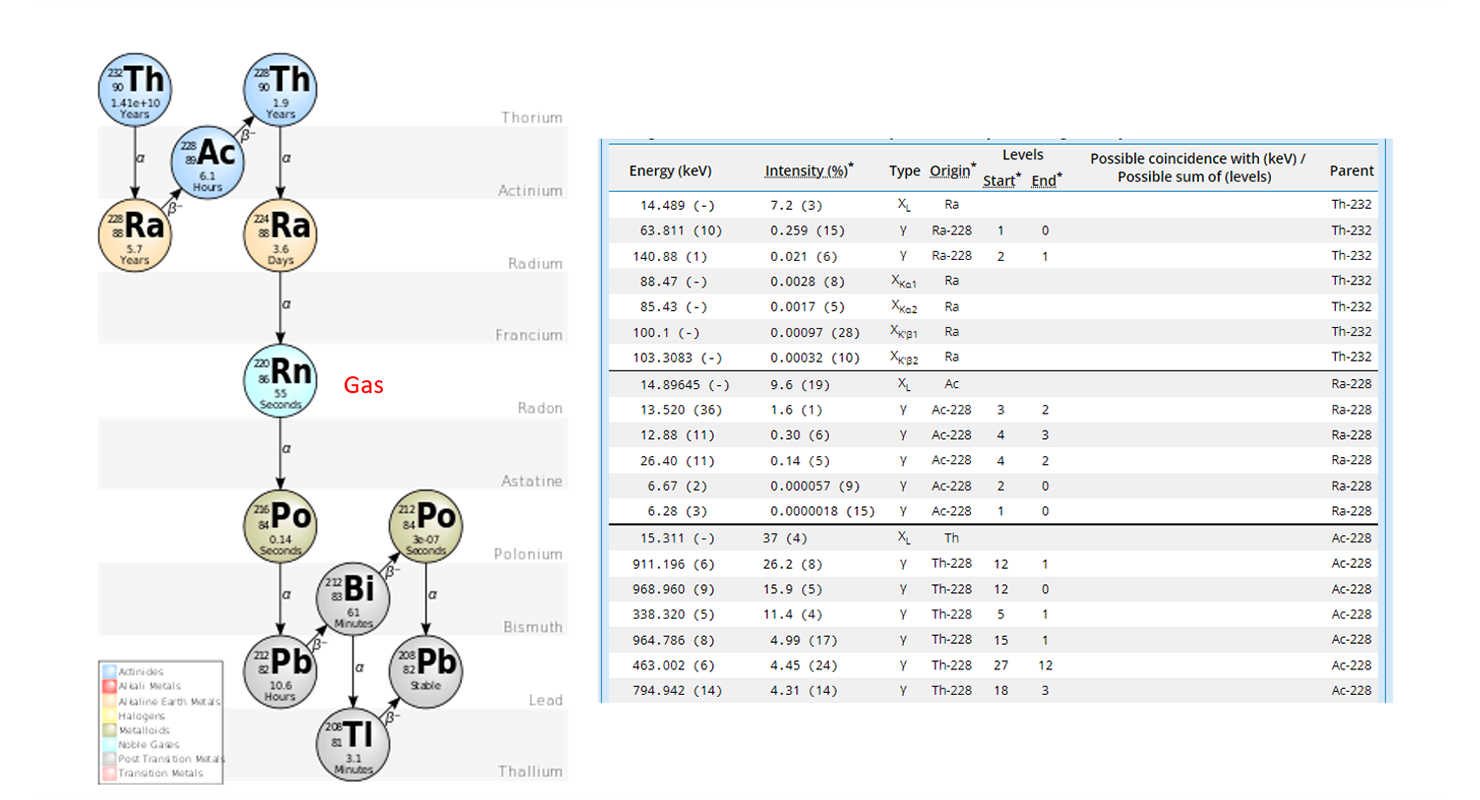
Q: Radon-228 values are not possible from in-situ gamma spectroscopy unless inferred from actinium-228? Please explain.
Greg: First of all, I want to mention that radon-228 is a member of the thorium series, which is significant. Radium-228 has no gammas of significance, nothing greater than 1%. Any of the X-rays that are coming off radium are going to be common to all of the species of radium in the thorium series and other series. Once you start dealing with the thorium series, I always start to factor in whether the uranium series is likely present—in a soil sample, for example—and potentially even look at the lines of the actinium series as well. So, actinium-228, which is downstream in the series (the daughter of radium-228), has many gammas, and a good number of those are of decent significance. I think the 911 keV gamma is at about 20-26%.
Something else you need to factor in is, assuming that the radium-228 is coming from thorium, if it is something that had been separated and isolated, you still have to deal with the downstream daughters of radium and factor in how far out of secular equilibrium you are. But if you are in secular equilibrium, like you are with something like a soil sample, then you can assume that the activities of all the members of the series are going to have roughly the same activity. Therefore, I can measure actinium-228, for example, at 911 keV, and assume that this is what my radium-228 activity is going to be.
So, looking at the slide, you can see thorium-232 and radium-228. You see there are some X-rays, and you have a 63 keV gamma—very low intensity. Under radium, you see the 26 at 0.14% intensity. You have some X-rays. They are common to the radiums in the thorium series. They are common to the radiums in the actinium series. They are common to the radiums in the uranium series. So, there is a lot of low-energy stuff going on that is going to interfere with trying to use something directly from radium-228.
Something else to consider when doing this series work; you want to identify where your radon is because that is a gas and is material leaving your sample. You will need to account for that. The thorium series is actually quite nice because all the key players are remaining in the sample unless you are worrying about thoron daughters down here. So, you can assume everything is in the sample.
Lastly, if you are going to do this and assume secular equilibrium (or some type of fractioning factor if you are not completely at secular equilibrium), you want to do two things: You want to not put in a sample date, or, you want to use a library that has all of the half-lives set to whatever the long-leading parent half-life is to get those numbers correctly.
Q: How do you manage a very high gamma dose item, specifically regarding dead time, high Compton, some shielding problems, as well as some surface contamination?
Nasser: High count rates for older equipment were always very troubling. With the rule of thumb 25-30% dead time, counts are meaningless. With modern MCAs you can go pretty high in terms of dead time: 95% or more in some cases, especially with some of the latest MCAs. So, you do not really have to worry about dead time too much. Just make sure you are counting for live time, that way you are actually getting the full count for your MDA.
For quantifying those, there are usually a couple of options to get rid of much of the Compton and the dead time: either a lot of shielding or a very small detector. A common practice is either pinhole apertures or very long collimation tubes. If you are familiar with the ISOCS cart and it has the tube, you can extend that out or withdraw it back to create a little more of a focused view—essentially a drop in your solid angle—so you see less of whatever is around it. If you can, back off and add distance. Sometimes it is the cheapest thing to do. But you may not have that liberty. Or, maybe you are in a hot cell or something like that where you are generating medical isotopes. When you are doing some of these shielded measurements, you will get a lot of characteristic X-rays, but especially if using lead. It is just easy to work with, so make sure you are not interfering in there, not having any summing or pile-up issues. Tungsten has its own naturally occurring peaks, too. So, if you are using a lot of tungsten that could impart some signal, but it is going to be far less.
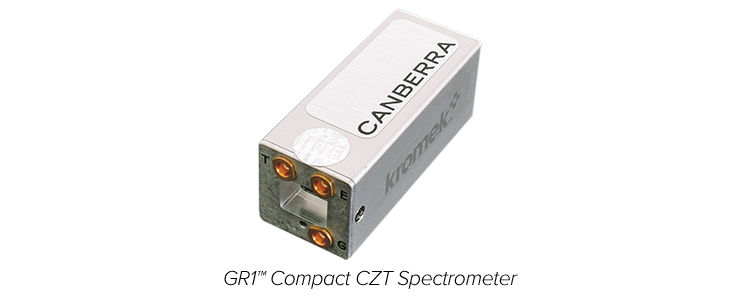
For these applications, it is a common practice to use the smallest one you can buy. CZT has been pretty good with this; we have one of our CSM system, a 1CC. You can get a 1CC germanium detector now with our MicroGe™ detector and that is going to cut out a lot of your extra background.
You are choosing between a REGe or coax detector and a BEGe™ detector, I would go with the BEGe detector. You will get a lot less background in the lower end. If you are close to the geometry and have those high activities, you want to watch for summing issues. They can really throw everything off, especially if you are looking at a high background where you can either get stuff lost or get extra stuff picked up in your spectrum.
It is sort of playing a game based on your situation. Hot cells are tough, so I would start with the smallest detector and then add shielding. A small detector does not require as much infrastructure or building material upfront.
Have an in-situ question for one of our experts? Contact Us »