Data Analyst™ Spectroscopic Monitoring Platform

Live Data for Timely Decisions
Elevate the gamma spectroscopic monitoring capabilities in your organization with the versatile, robust Data Analyst™ platform. Compatible with an extensive array of detectors and designed for seamless integration into diverse monitoring infrastructures — including stack monitors and robotic platforms — this platform addresses immediate data acquisition needs including real-time alerts and triggering mechanisms.

Applications Using Continuous Gamma Spectral Acquisition and Analysis
The Data Analyst system is a compact, powerful device that can be seamlessly integrated into diverse monitoring infrastructures — including stack monitors, unmanned aerial vehicles, and more. Explore a few uses of the platform in the examples below.
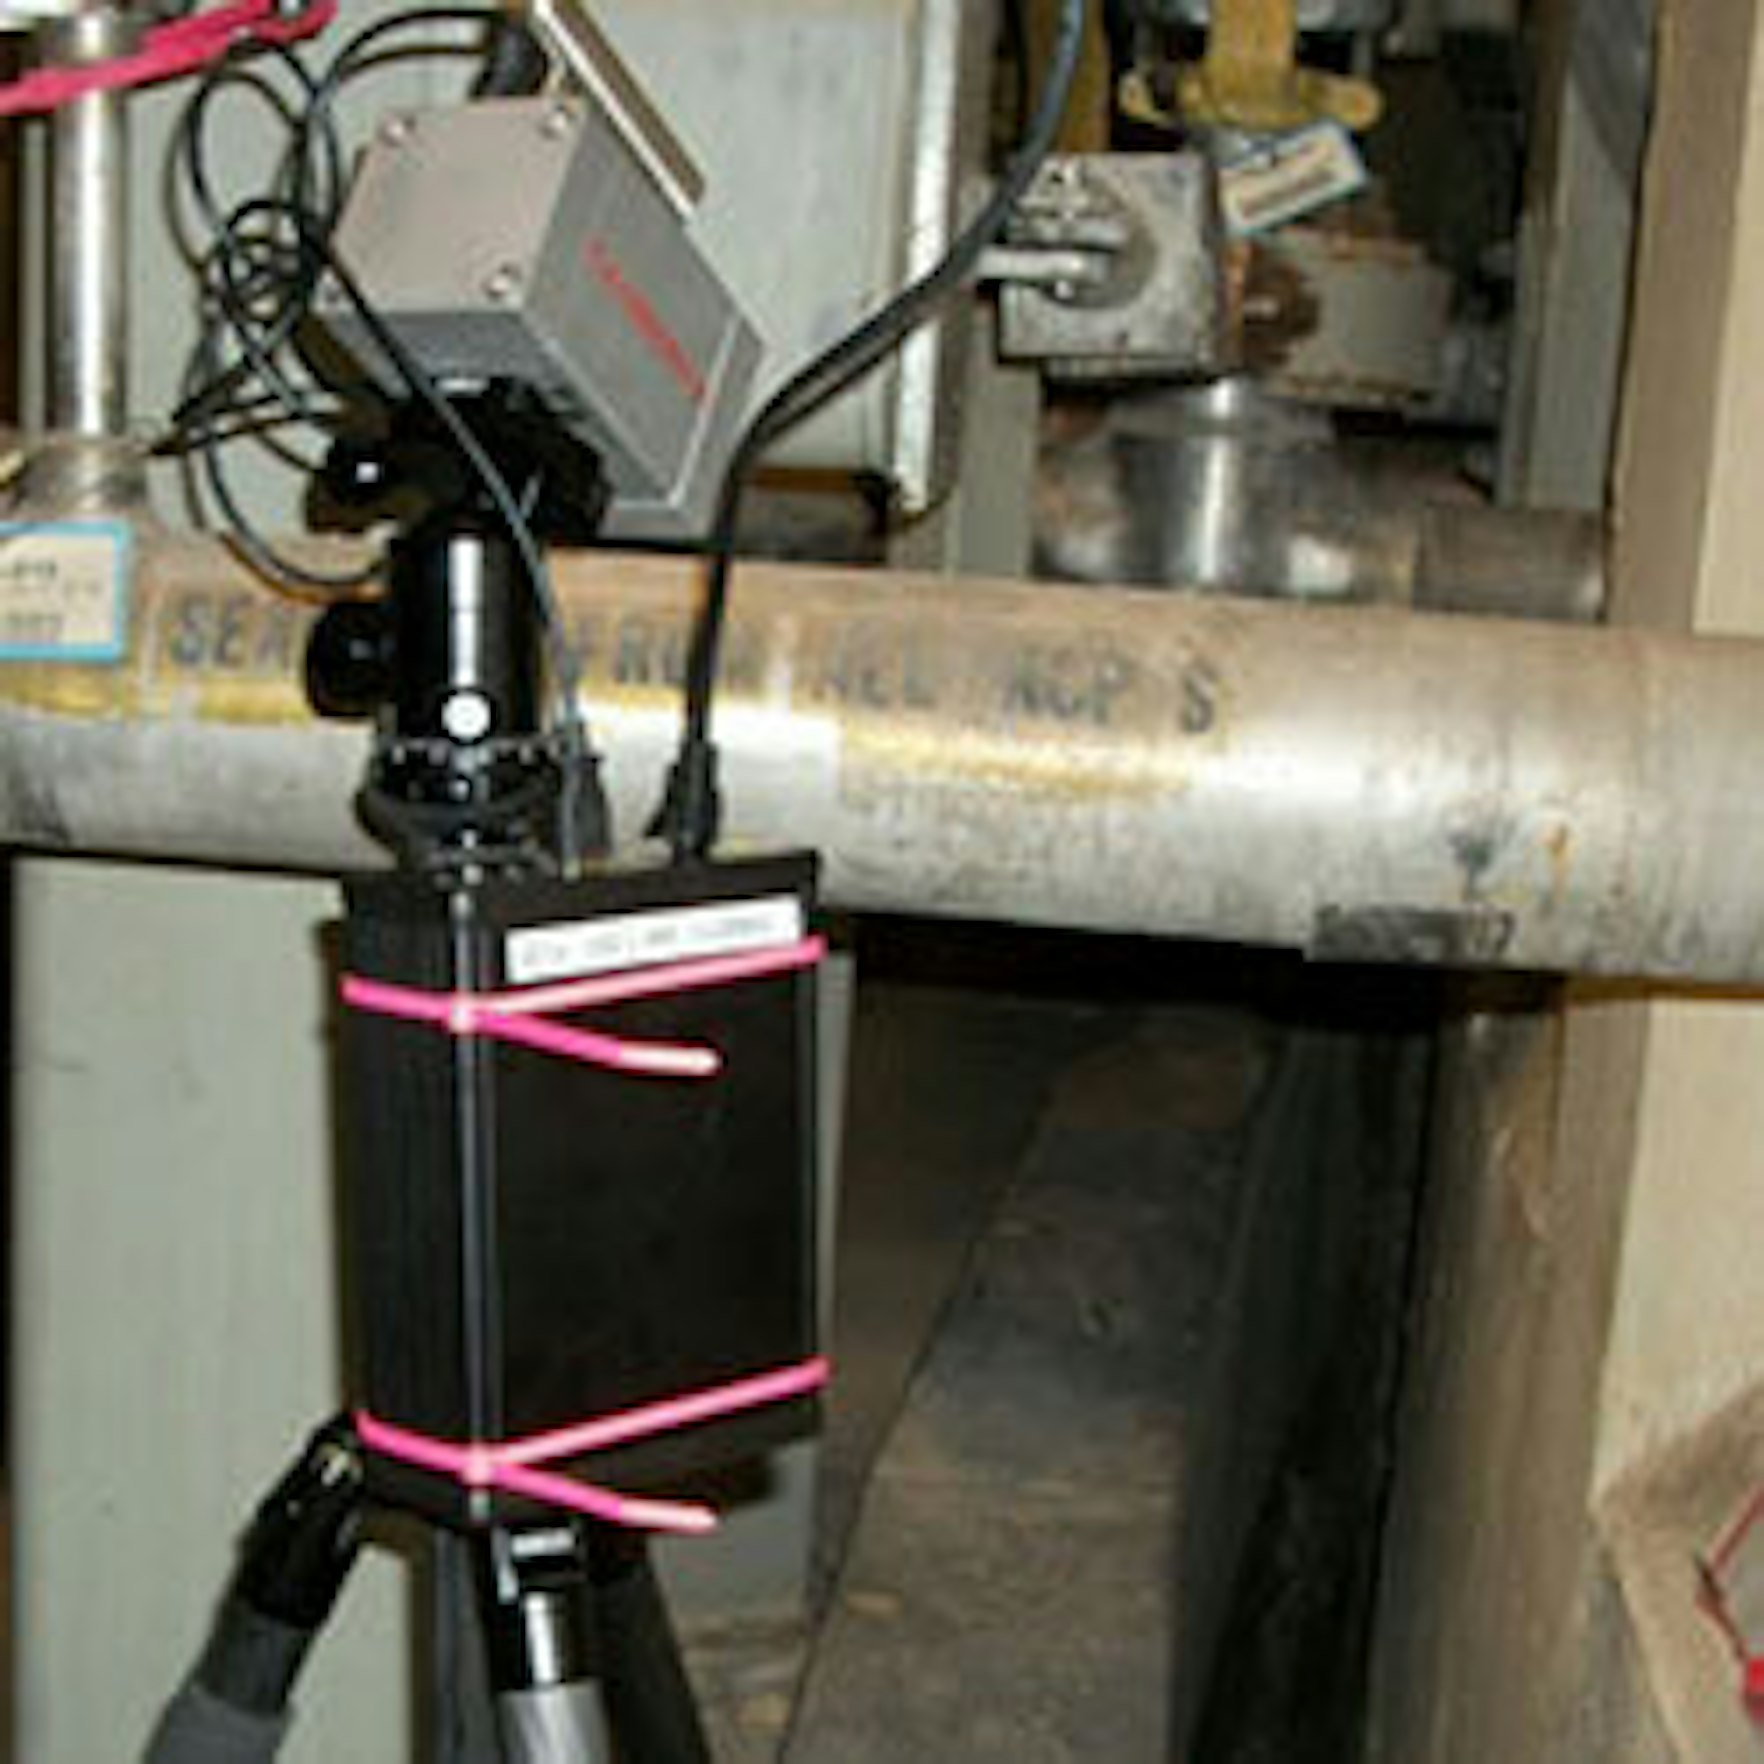
Nuclear Power Plant In-Situ CZT System
Five demonstration measurement campaigns, partially funded by EPRI, use a shielded collimated CZT detector aimed at a pipe with primary coolant. These have been performed on four different reactors. Generally, these covered an outage cycle, but one deployment covered the entire fuel cycle of two years.

Robotic Measurements of Ground and Floor Activity at Release Levels
An EPRI-furnished robot is programmed to autonomously drive a predetermined pathway. Suspended from the robot are two separate NaI spectrometers and two Data Analyst modules. Nuclide analyses from each detector are sent to the robot and transmitted to the remote viewer every three seconds.

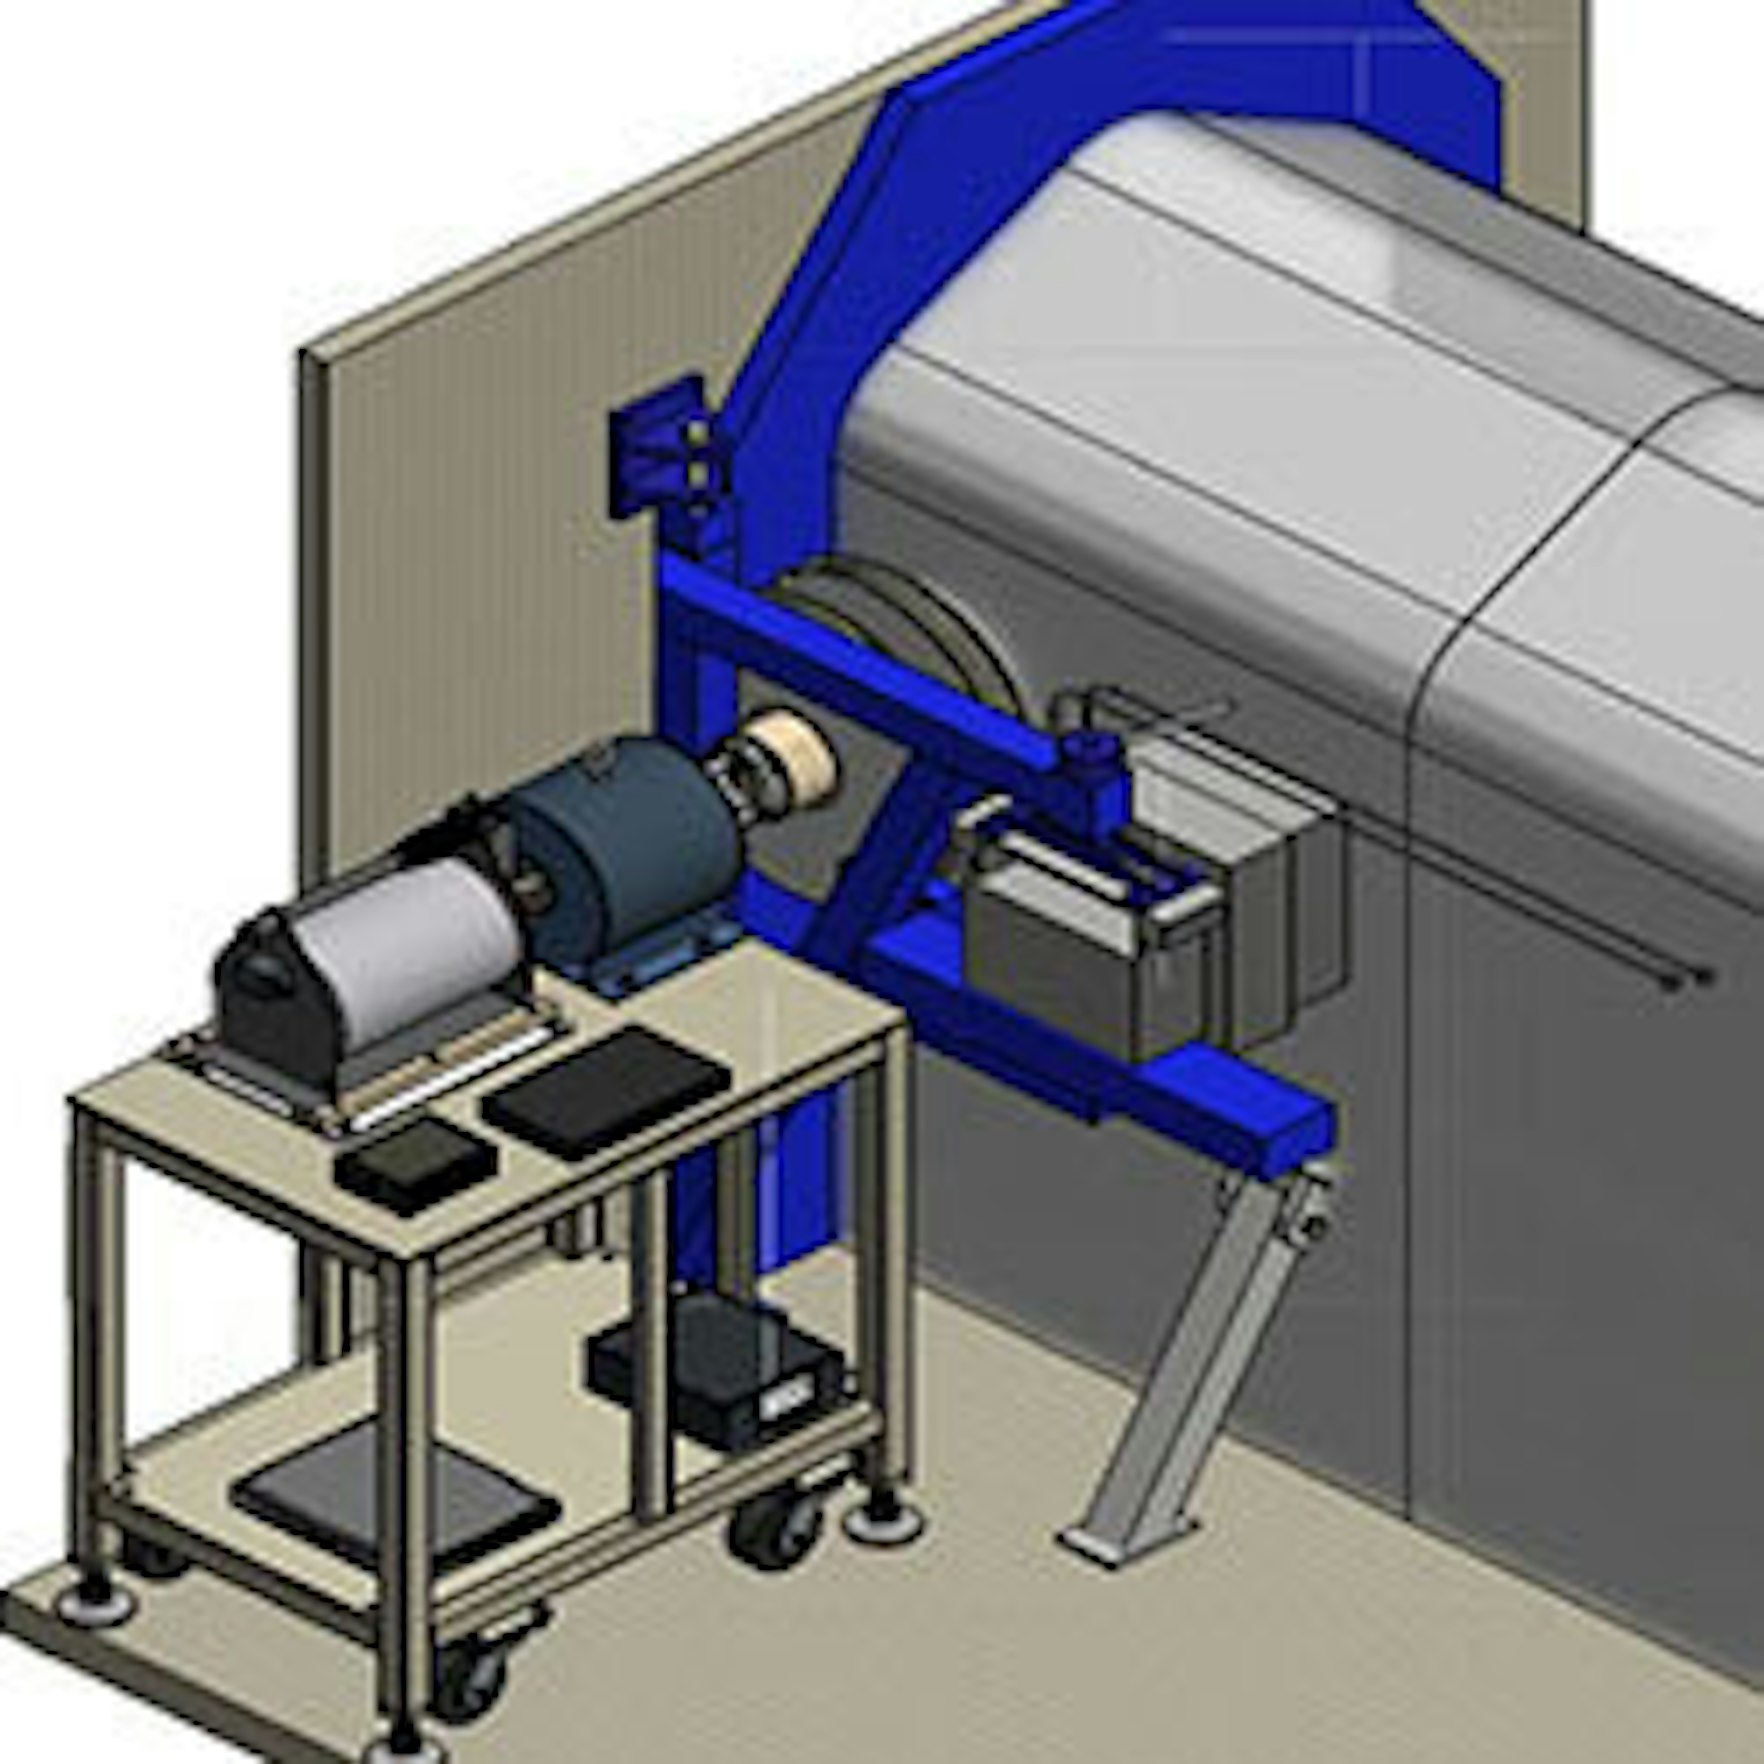
Stack Gas Monitor HPGe System
Five Data Analyst units have been delivered to various reactor sites in Europe, USA, and Australia. These all have a shielded HPGe detector and a large Marinelli beaker for the gas. They are designed to measure a very wide (8-decade) dynamic range of gas concentration.
Remotely Triggered Assay of Radiopharmaceutical Samples
At a reactor irradiation site, vials of freshly activated starting materials to produce Lu-177 are assayed to confirm proper activation and minimal impurities. A heavily shielded and collimated CZT detector is used to measure the sample vials, which each contain ~3x10¹²Bq of activity.
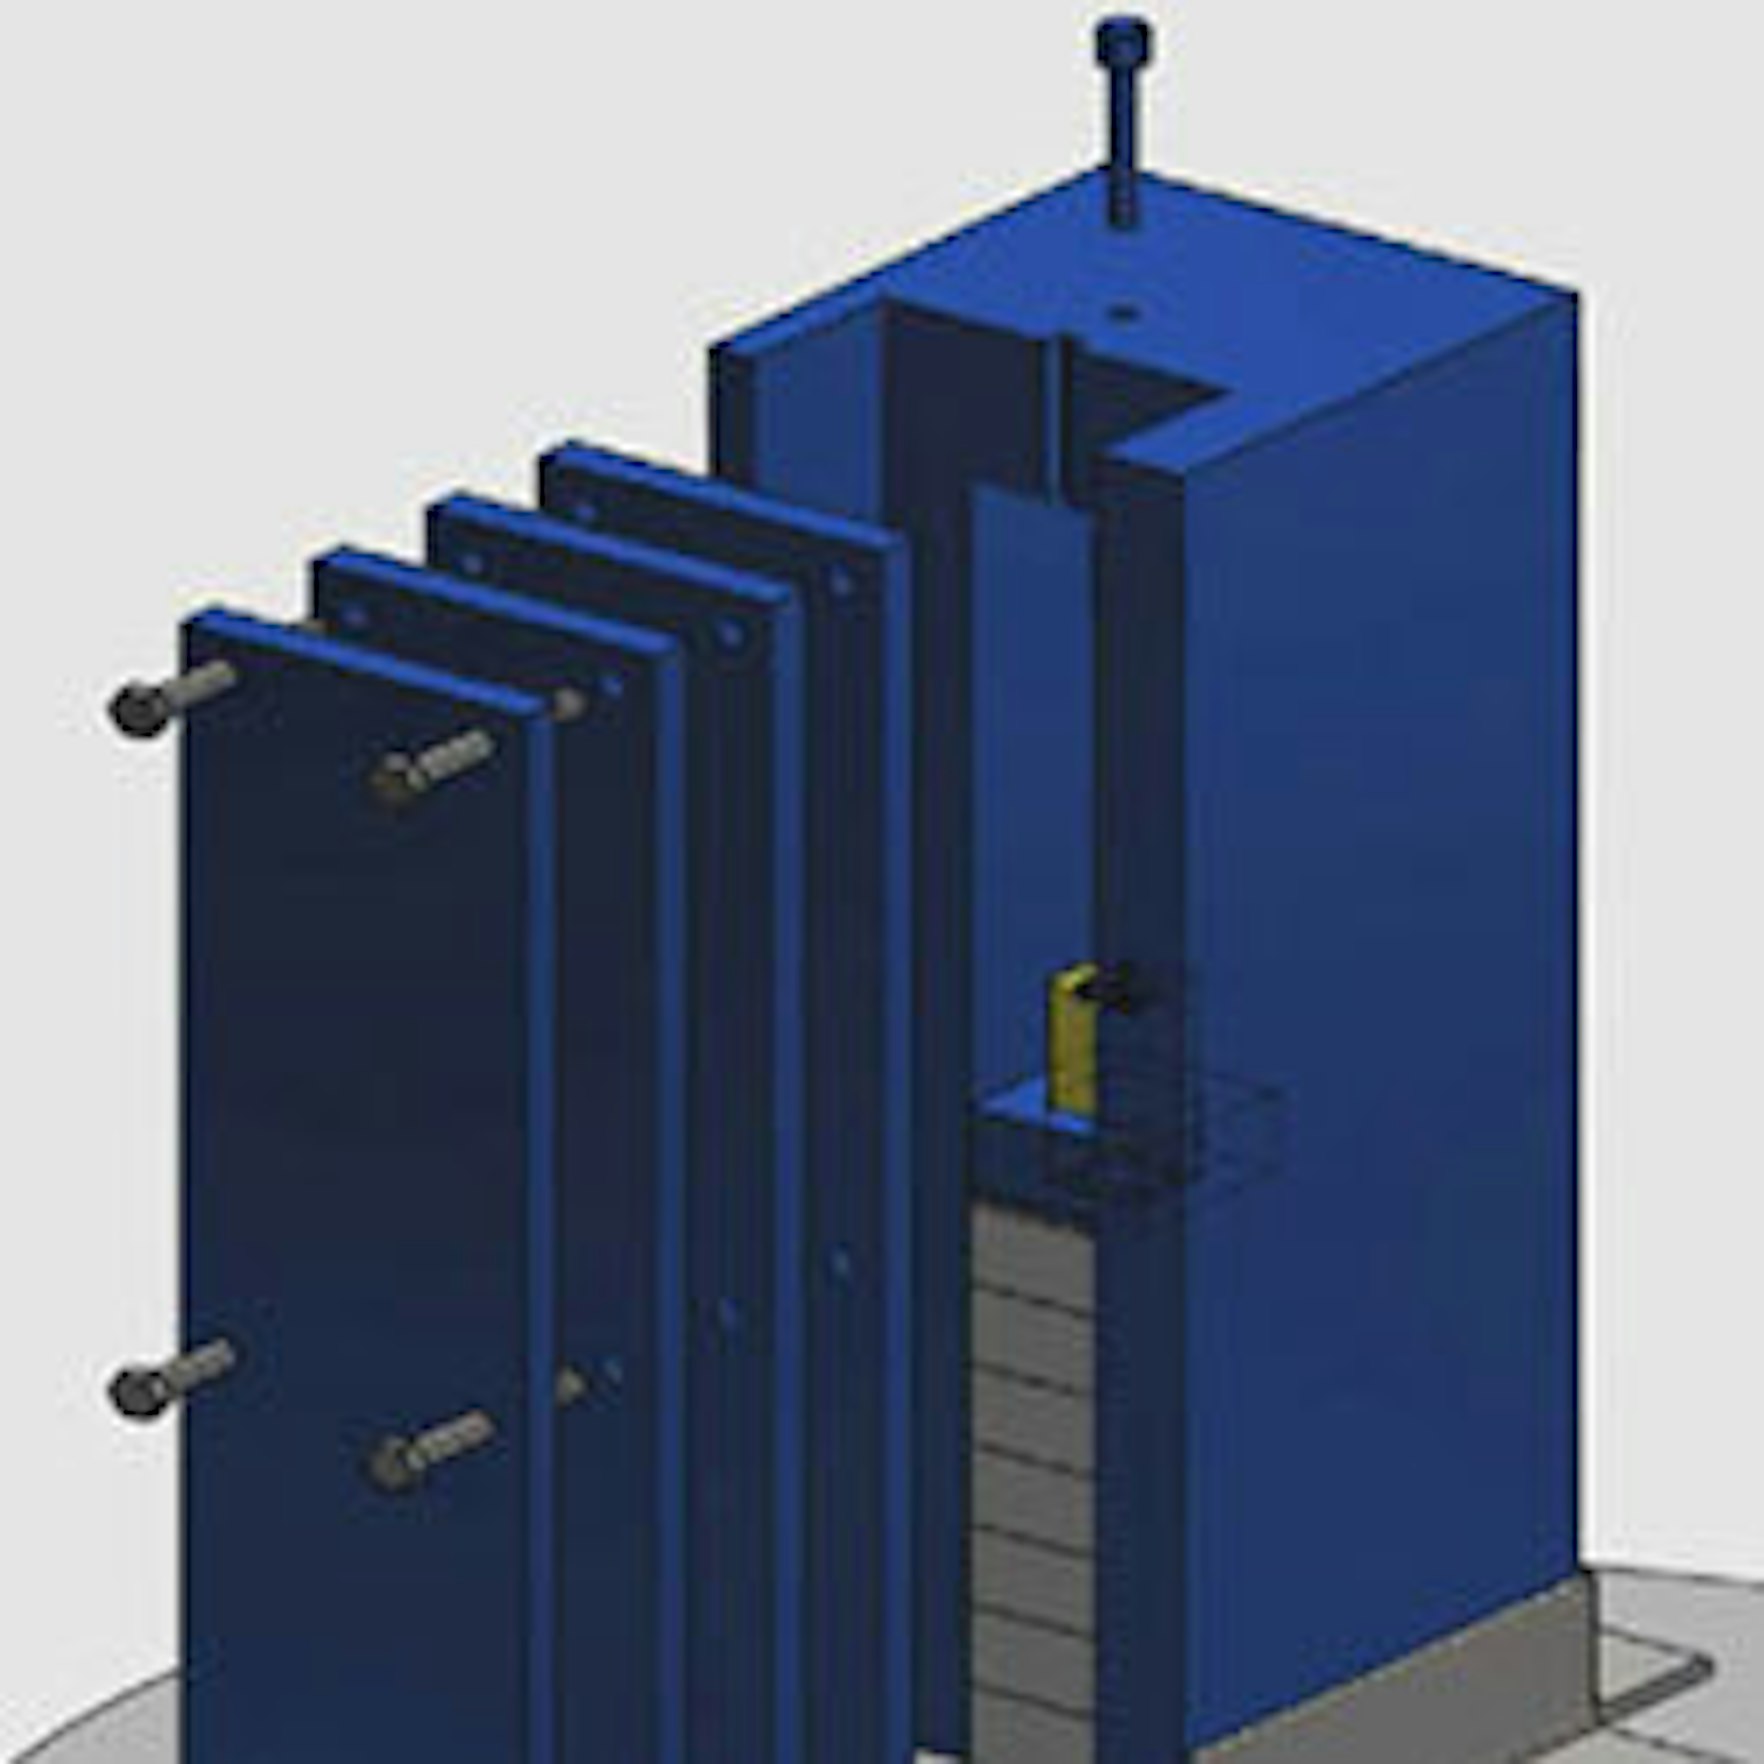
Fuel Rod Scanner at Nuclear Research Facility
This has a heavily collimated HPGe detector viewing a 0.5 mm wide section of the fuel rod. Here the triggered mode of the Data Analyst Platform is used to acquire a single spectrum, then the fuel rod is moved a bit, and the sequence repeated.

Ready to see how the Data Analyst platform can transform your work?

Move Beyond Manual Sampling
Once set up and activated, the Data Analyst system runs autonomously. It supports various triggering methods, enabling on-demand gathering and examination. A nuclide activity alarm calculation informs the user of any unacceptable activity. High-capacity storage captures years’ worth of results from constant surveys.
Analyze Your Data Without Getting Overloaded
The Data Analyst platform is designed to handle and analyze large amounts of data without overwhelming the user.
- Record data such as dose rate, temperature, pressure, location, stack flow rate and sample flow rate from a variety of devices.
- Configure and monitor nuclide readings from real-time and previous data through a web-based platform.
- Conduct multiple analyses simultaneously, with variable count times, nuclide libraries and analysis parameters.
- Use ISOCS™ software mathematical efficiency calibrations for precise quantitative assay results for intricate geometries.
- Instantly transmit data and spectra to an FTP server, via WiFi, and Ethernet communication methods.
Simplify Equipment Setup and Daily Operations
The Data Analyst system offers a convenient, all-in-one solution for comprehensive nuclide identification and quantification, with embedded Genie™ software algorithms for streamlined data processing. It has versatile options that are useful for receiving triggered inputs and for alerting, alarming, and fault outputs. Additionally, it can connect with EcoGamma™ Monitors to record local dose rate through either a USB or Ethernet connection.
Compatible with a Variety of Detector Types
The Data Analyst platform is purpose-built for compatibility. It can be used in conjunction with:
- Lynx® II Digital Signal Analyzer with HPGe or scintillation detectors;
- Osprey® Tube Base MCA with scintillation detectors; and,
- The GR1™ family of miniaturized CZT spectrometers
Webinar: Maximizing Spectroscopic Data Efficiency and Accuracy with the Data Analyst™ Continuous or Triggered Spectroscopic Monitoring Platform
Learn how the Data Analyst platform automates the processes of nuclide identification and quantification, and eliminates the necessity for labor-intensive, risk-prone manual sampling with a fully automated, high-capacity system that retains years' worth of analytical results. Plus, hear about real-world applications demonstrating the capabilities of the Data Analyst Platform in multiple environments.
Presented by Greg Landry, the Product Line Manager for In Vivo products. With over 35 years of expertise in the field, he is a recognized subject matter expert in gamma spectroscopy, in vivo measurements, and internal dosimetry.
Available Accessory Software
Additional compatible software supports expanded use cases.
- DA-Prospector software provides advanced multi-nuclide graphical trending and reporting capabilities to easily review and evaluate months of archive data. It can read data archive files produced by a Data Analyst system.
- Horizon® Platform is a supervisory system that provides visibility and oversight to a network of radiation monitoring systems. It gives users access to live data from instruments around the site and the ability to perform DA-Prospector Data Visualization and Trending remote operations that the instruments support.

How can the Data Analyst platform change the way you measure radiation?
We’re here to help you find the right solution for your needs. Get in touch to start a conversation.