Lab Experiment 1: Gamma-Ray Detection with Scintillators
Print
Purpose:
To demonstrate the use of a NaI scintillator detector and its response to gamma rays.
To demonstrate the three dominant gamma-ray interactions with matter.
To demonstrate energy calibration.
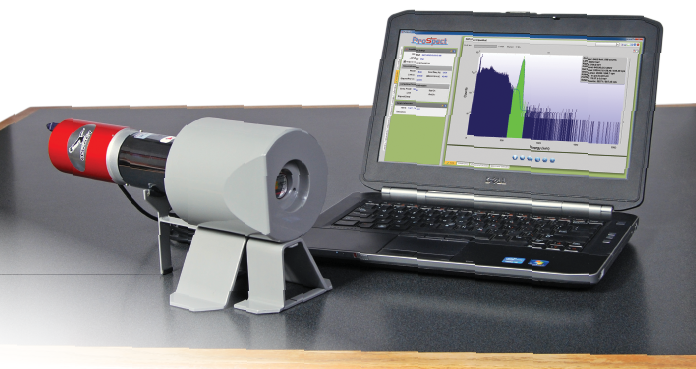
Equipment Required:
Theoretical Overview:
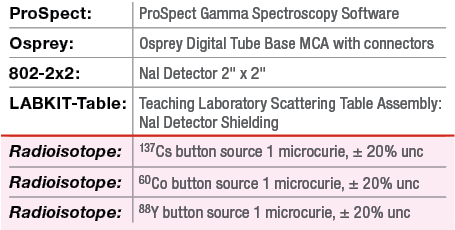
How gamma rays are produced Radioactive nuclei decay by emitting beta or alpha particles. Often the decay is to an excited state in the daughter nucleus, which usually decays by emission of a gamma ray. The energy level sequence and therefore the gamma-ray energy spectrum for every nucleus is unique and can be used to identify the nucleus. The energy levels and decay process of 22Na, 60Co and 137Cs are given in Figure 1-1. The term beta decay means β- (electron), β+ (positron) emission or electron capture by the nucleus.
Figure 1-1: Energy level sequences for 137Cs, 60Co and 22Na (energy levels in MeV)
NaI(Tl) detectors
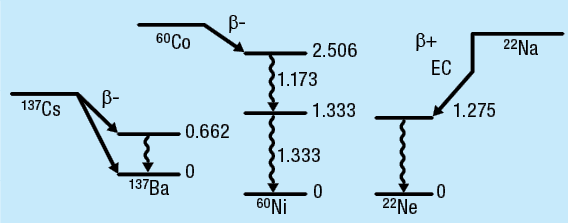
The thallium-activated sodium iodide detector, or NaI(Tl) detector, responds to the gamma ray by producing a small flash of light, or a scintillation. The scintillation occurs when scintillator electrons, excited by the energy of the photon, return to their ground state. The detector crystal is mounted on a photomultiplier tube which converts the scintillation into an electrical pulse. The first pulse from the photocathode is very small and is amplified in 10 stages by a series of dynodes to get a large pulse. This is taken from the anode of the photomultiplier, and is a negative pulse.
The NaI(Tl) crystal is protected from the moisture in the air by encasing it in aluminum, which also serves as a convenient mounting for the entire crystal/photomultiplier unit. A schematic is shown in Figure 1-2.
Figure 1-2: lllustration of a scintillation event in a photomultiplier tube
Gamma-ray interactions with matter
There are three dominant gamma-ray interactions with matter:
Photoelectric effect
Compton effect
Pair production
The photoelectric effect is a common interaction between a low-energy gamma ray and a material. In this process the photon interacts with an electron in the material losing all of its energy. The electron is ejected with an energy equal to the initial photon energy minus the binding energy of the electron. This is a useful process for spectroscopy since an output pulse in a detector is produced that is proportional to the gamma-ray energy, as all of the energy of the gamma ray is transferred to the detector. This produces a characteristic full-energy peak in the spectrum that can be used for the purpose of identifying the radioactive material.
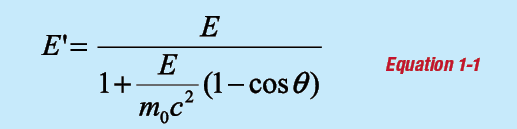
The photon can scatter by a free electron and transfer an amount of energy that depends on the scattering angle. This process is called Compton scattering. The energy of the scattered photon E′ is:
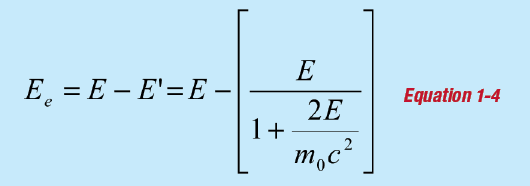
where E is the incident gamma-ray energy and θ is the angle of scatter. The term m0c2 is the rest mass of the electron, equal to 511 keV. The energy given to the electron is:
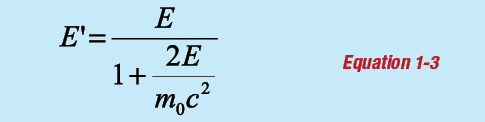
The maximum energy given to an electron in Compton scattering occurs for a scattering angle of 180°, and the energy distribution is continuous up to that point (since all scattering angles up to 180° are possible). This energy, known as the Compton edge, can be calculated from the incident gamma ray energy.
For θ = 180°:
and:
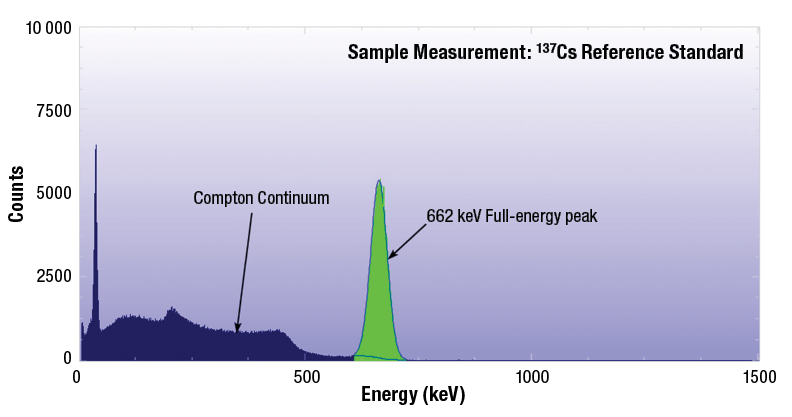
The spectrum for 137Cs shows that if the gamma ray scatters and escapes the crystal then the energy deposited will be less than the full-energy peak (see Figure 1-3).
The actual energy deposited depends upon the angle of scatter as described in the equations above. The spectrum shows that many pulses have energies in a range below the Compton edge – called the Compton Continuum.
If the gamma ray does not escape the crystal and scatters again giving up its remaining energy through the photoelectric effect, then its full energy will be deposited in the full-energy peak (at 662 keV for 137Cs). This is more likely for larger crystals.
Pair production can occur when the gamma-ray energy is greater than 1.022 MeV and is a significant process at energies above 2.5 MeV. The process produces a positron and electron pair that slow down through scattering interactions in the material. When the positron comes to rest, it annihilates with an electron producing a pair of 511 keV gamma rays that are produced back-to-back. These can be absorbed through the photoelectric effect to produce full-energy peaks at 511 keV. A component due to Compton scattering can also be observed. When a photon interacts with the crystal through pair production, one or both of the annihilation photons can escape undetected from the crystal. If one of the photons escapes undetected, then this will result in a peak in the spectrum at an energy of 511 keV less than the full-energy peak. This is called the single escape peak. Similarly, if both photons escape undetected, a peak will appear 1022 keV below the full-energy peak, called the double escape peak.
Figure 1-3: Example spectrum of a 137Cs source
Experiment 1 Guide:
Photoelectric effect and Compton scattering
1. Ensure that the Osprey (with the NaI(Tl) detector connected) is connected to the measurement PC either directly or via your local network.
2. Place the 137Cs source in front of the detector.
3. Open the ProSpect Gamma Spectroscopy Software and connect to the Osprey.
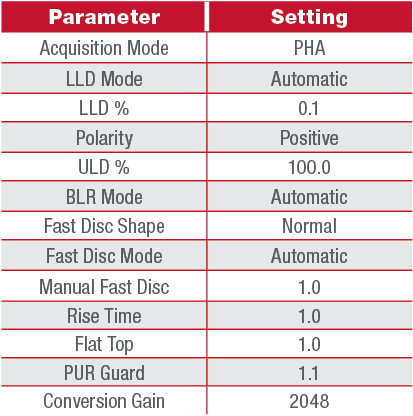
4. Adjust the MCA settings to correspond with those listed in Table 1-1. It is recommended to use these settings throughout this manual unless otherwise specified.
5. Use the software to apply the recommended detector bias to the NaI(Tl) detector.
6. Set the amplifier gain such that the photopeak is close to 40% of the full range of the spectrum.
7. Acquire a spectrum (use a count time such that there are at least 10 000 counts in the photopeak).
8. Use annotations (using the right click menu) to identify the Photopeak, the Compton Continuum and the Compton Edge.
9. Copy the spectrum to clipboard and paste into a Word document (provide an appropriate caption for the spectrum).
10. Save the spectrum.
Table 1-1: Standard Gain and Filter Settings for NaI 2x2 with Osprey or Lynx II
Pair production
11. Clear the spectrum.
12. Replace the 137Cs source with a 88Y source.
13. Acquire a spectrum (use a count time such that there is at least 10 000 counts in each photopeak).
14. Use annotations (using the right click menu) to identify the 898 keV and 1836 keV full-energy peaks. Also Identify the single escape peak from 1836 keV, which should have an energy of 1836 – 511 = 1325 keV.
15. Copy the spectrum to clipboard and paste into a Word document (provide an appropriate caption for the spectrum).
16. Save the spectrum.
Energy calibration
17. Load the 137Cs and 88Y spectra.
18. By left-click dragging a region of interest across each peak, determine the centroid channel for the 662 keV, 836 keV and 1836 keV full-energy peak. Note down the centroid channel and uncertainty for each peak as presented by the tooltip in ProSpect.
19. Using Microsoft Excel or another spreadsheet or graphing application, enter the energy, channel and the uncertainty in channel. Plot the energy vs. channel (with channel uncertainties displayed as error bars).
20. Use the spreadsheet to calculate the energy calibration coefficients. Enter these into ProSpect using the Calibration tab for the detector.
21. Collect a 60Co spectrum and identify the energies of the two full-energy peaks.